In our last article we talked about first few criteria which for the sellers which start from the standard. In this part 2 we will talk about the other criteria which affect the performance of a seller in Amazon step dashboard
Prime Listing Customers Views.
As previously mentioned this metric only applies to the seller who is in the Advanced & Premium level. Now that is out of the way let’s begin. At this level, the total number of customer views on your prime offers is divided by the total number of customer views on your products.
The calculation looks something like this.
I know it can be confusing so let’s understand this with an example. Let’s say that a seller has 20 views on their prime offers and they have 100 views on all of their listing then prime listing customer view will be 20%. The total number of customer views on your product will include all of your listings.
How to improve Prime Listing Customers Views?
Keep your products in other fulfillment centers. As you know that if you having prime listing means that you would have to ship the product on the same day on which the customer has placed the order. This would not be possible if the order is placed from the other side of the country. That it is why it is advised that you keep your products in multiple fulfillment centers. By doing this you would make sure that you can ship the product on the same day.
If you are an Easy ship seller, enroll your products on Seller Fulfilled Prime. This means the seller has access to ship the product on the same day but for limited locations.
Prime eligible sellers should prioritize high-demand ASINs while enrolling for any of the above-mentioned Prime channels.
Regional In-Stock Premium level.
Now, this one is a little bit complicated so I will try to keep it simple. Let’s say that you have replicated your inventory in Delhi and you have won the buy box on a product Customer view on the buy box winning product is 10,000 and out of which customer views coming from Delhi on that product is 3500, then the Regional In-Stock % is 35%.
The calculation for the above example.
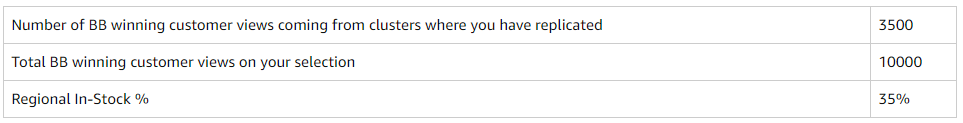
The formula for the calculation for the Regional In-Stock is done by dividing the number of the buy box wining customer views coming from cluster where the seller is replicated by the number of the total buy box wining customer views on sellers selection. So the formula looks something like this.
Now going back to the above example “the number of the buy box wining customer views coming from cluster where the seller is replicated” means the number of customers coming from locations where you have placed your product E.g Delhi in the there are 3500 buy box wining customer views. Now, this 3500 is divided by the total buy box wining customer views on sellers selection which is 10,000. So putting these values in the formula we get the result of 35%.
Even now if you are confused it can be boiled down to one simple thing and that is you should have your product (in stock) in different regions.
How to improve Regional In-Stock?
If you are an FBA seller, replicate your inventory in maximum clusters. This means that you should have your product in almost every high-demand location so that if you receive an order you can ship the product on the same day.
Know your demand using rim tool, click here to go to the tool. and keep your products in stock in the same ratio so that there is not an extra product in one region and no product in stock for another region.
Place your product in the metro city where the demand is high.
Net Sales Volume and Net Sales Unit
Net Sales Volume and Net Sales Unit
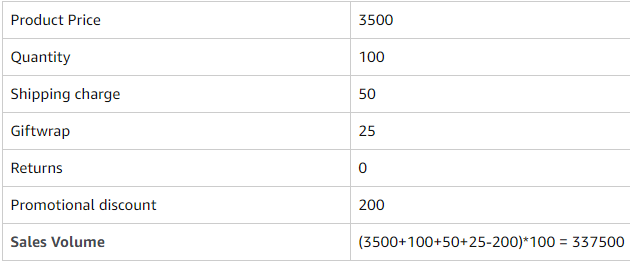
Net Sales Volume is the total value of products provided to customers on Amazon at the price listed on the products’ detail page during the specified time period. This excludes return or canceled products. To put it in layman terms Net Sales Volume include every amount that amazon spends to sell the product to the consumer. This includes the following.
- Product Price
- Shipping
- Giftwrap
Net Sales Volume = Product Price * Quantity + Shipping + Giftwrap – Returns – Promotional Discounts
Net Sales Unit is the Number of products which were sold to the customers during the specified time period. This excludes return or canceled products. The calculation looks something like this.
How to improve Net Sales Volume/Net Sales Unit?
- Maintain competitive low pricing on all your products to increase the chances of winning Buy Box.
- Know the demand of your product in the market and replicate your inventories in the Fulfillment Channels accordingly.
- Bring more selection on the catalog to increase customer engagement.
- Minimize seller canceled orders and customer returns.
You might also be interested in our other articles.
Click here to read about How to start selling on amazon in 5 steps.
Click here to read about Ultimate guide to amazon STEP dashboard 2021 part 1
Click here to read about Ultimate guide amazon STEP dashboard 2021 part 2
Click here to read about What is a local shop on Amazon and how to use it?
Click here to read about What is buy box and how to win it?
Click here to read about Best amazon FBA prices calculators of 2021.